Geospatial intelligence serving territories
A geospatial intelligence consultancy. We support local authorities in understanding and monitoring their territory through aerial drone imagery, artificial intelligence and human expertise.
Territories are constantly changing
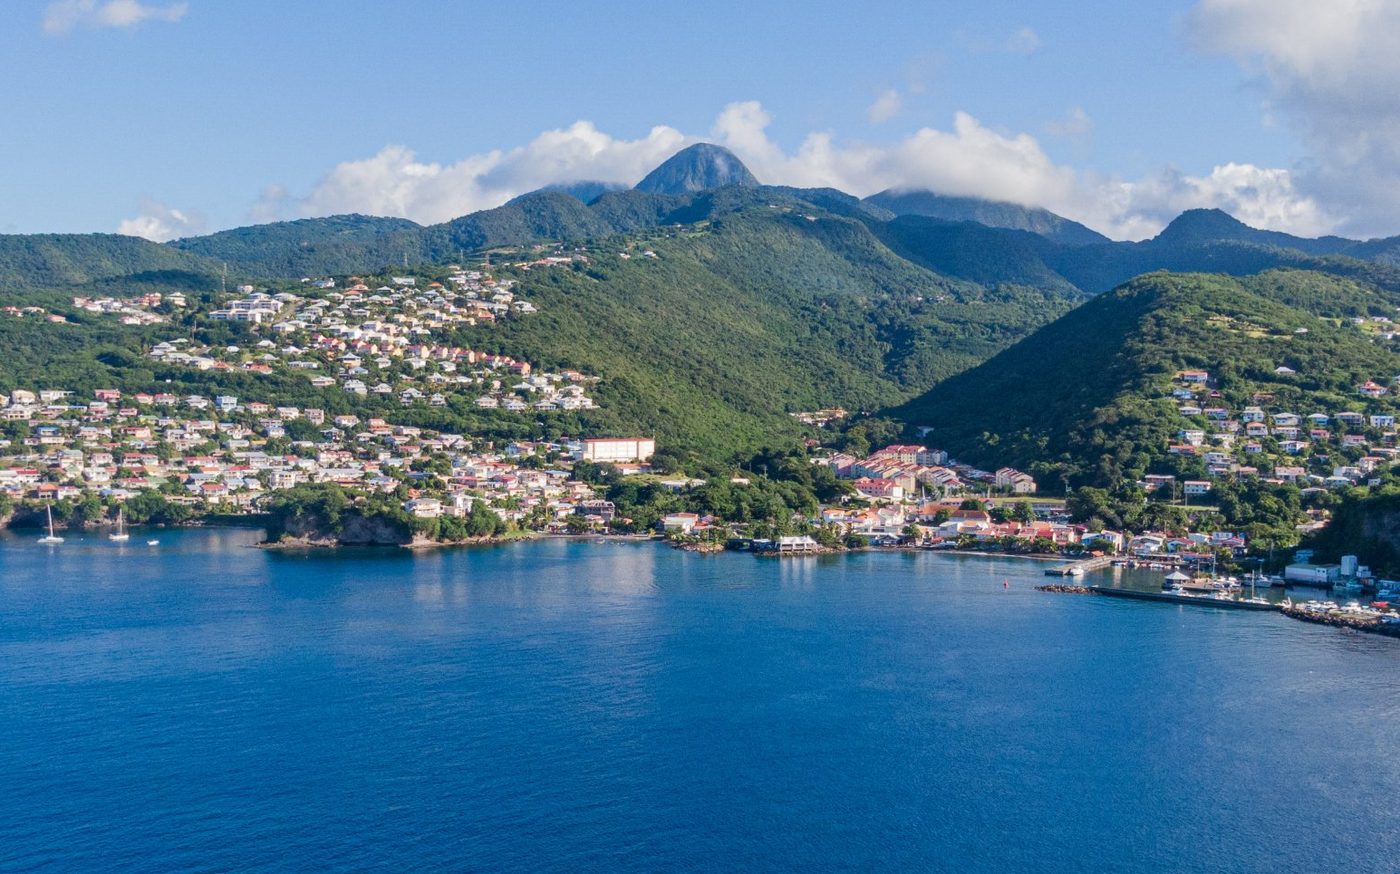
Over time, territories change: new buildings, extensions, swimming pools, developments, demolitions. A building can change long after it was built, and these changes are not always reflected in the administrative information available.
For local authorities, staying up to date is a challenge, with tight budgets, limited resources and time-consuming field checks. Across territories that can be large, these checks tie up staff for long periods, and some properties remain hard to see from public space.
Administrative information can then drift away from reality, with an impact on the reliability of tax bases and on the authority's resources. Having reliable, up-to-date knowledge of the territory has become essential to identify, understand and monitor these changes.
Territorial knowledge that needs updating
Having an up-to-date inventory of buildings, extensions and developments.
Significant administrative and tax stakes
Making the databases used by departments more reliable and securing the authority's revenue.
Limited resources and time-consuming methods
Reducing the time spent on manual research and systematic field checks.
Reliable knowledge of the territory
We identify the changes that have occurred in your territory (new buildings, extensions, demolitions, swimming pools, marine jetties). Each one is precisely located, checked by an operator, then delivered turnkey, ready for your departments to use.
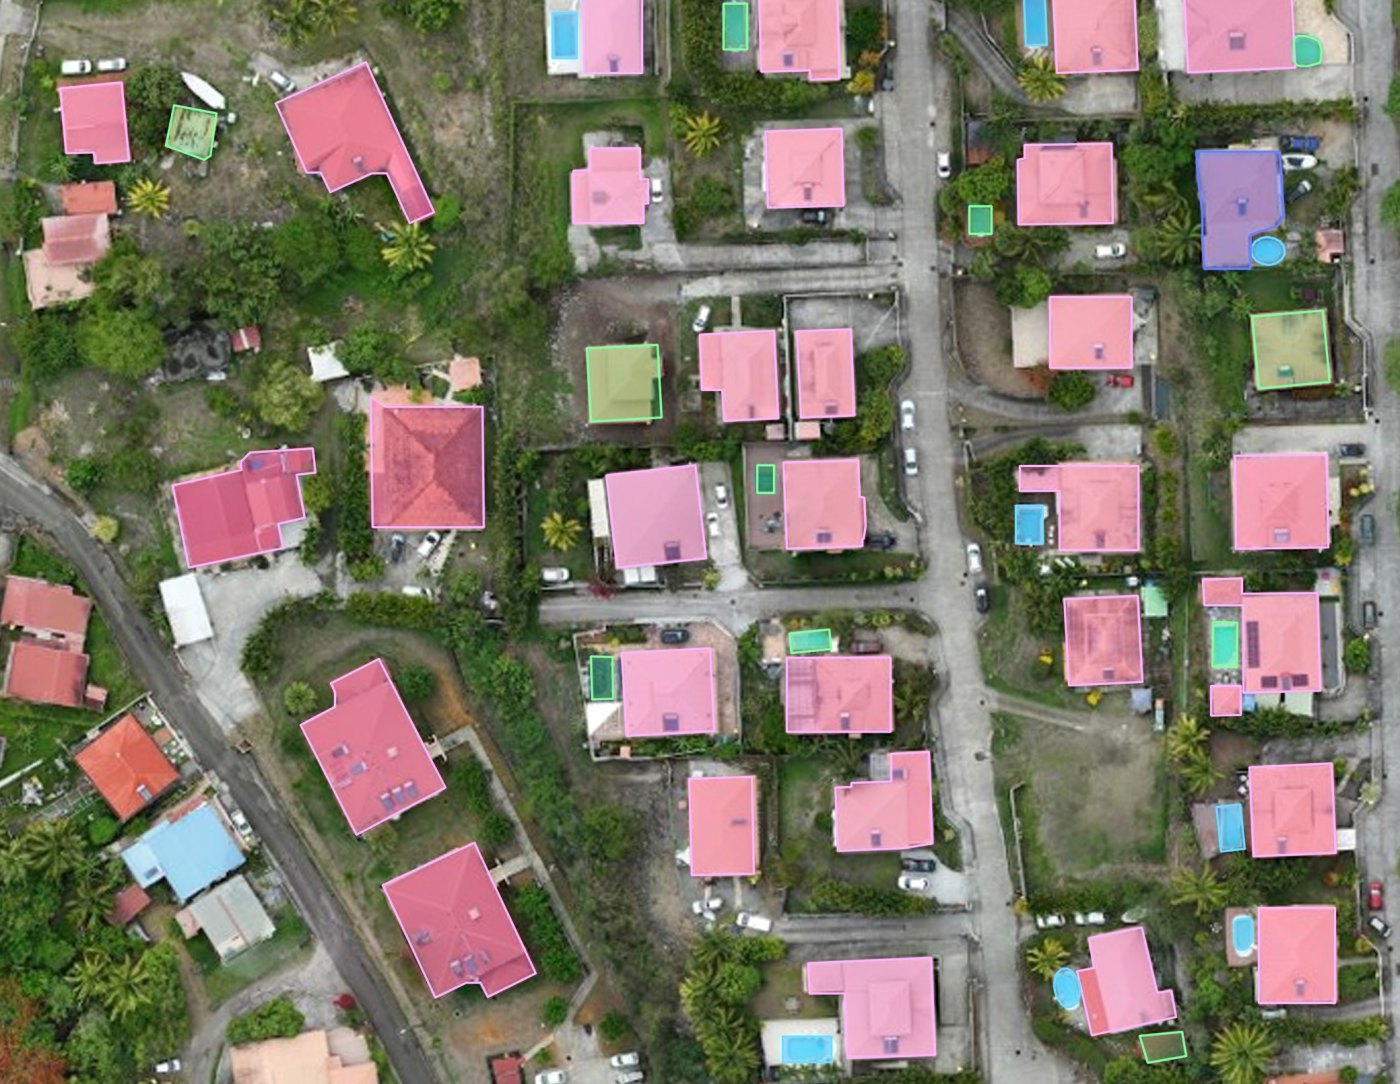
Observe
Gain precise, up-to-date knowledge of the territory.
Detect
Identify and locate changes between survey campaigns.
Analyse
Turn observations into usable information.
The benefits for your local authority
Up-to-date, objective and usable territorial information that saves your departments time and secures your databases.
Making tax bases more reliable
Identifying situations that need checking can contribute to the reliability of tax bases and, where a regularisation applies, to better use of resources by the authority.
This is the goal of « Foncier innovant », a project of the French tax authority (DGFiP), in the service of tax fairness. See the national case study
Time savings
Fewer field checks, focused on the situations that need them: your staff step in where it matters.
Prioritisation
Situations to check are located and ranked by importance, to guide your departments' action.
Updatable data
More recent territorial information, updated with each new campaign.
Fairness
The same level of information for every area and every owner, including properties that are hard to see from public space.
Reusable data
Maps and GIS data that also serve urban planning, development and land management.
Documentation
Objective, traceable geographic evidence: dated image, precise location, report.
Observing and detecting changes
GEO DATA ANALYSE works in two stages: an initial audit that identifies existing features and notes any cadastral discrepancies, followed by successive campaigns designed to detect and document changes in the territory.
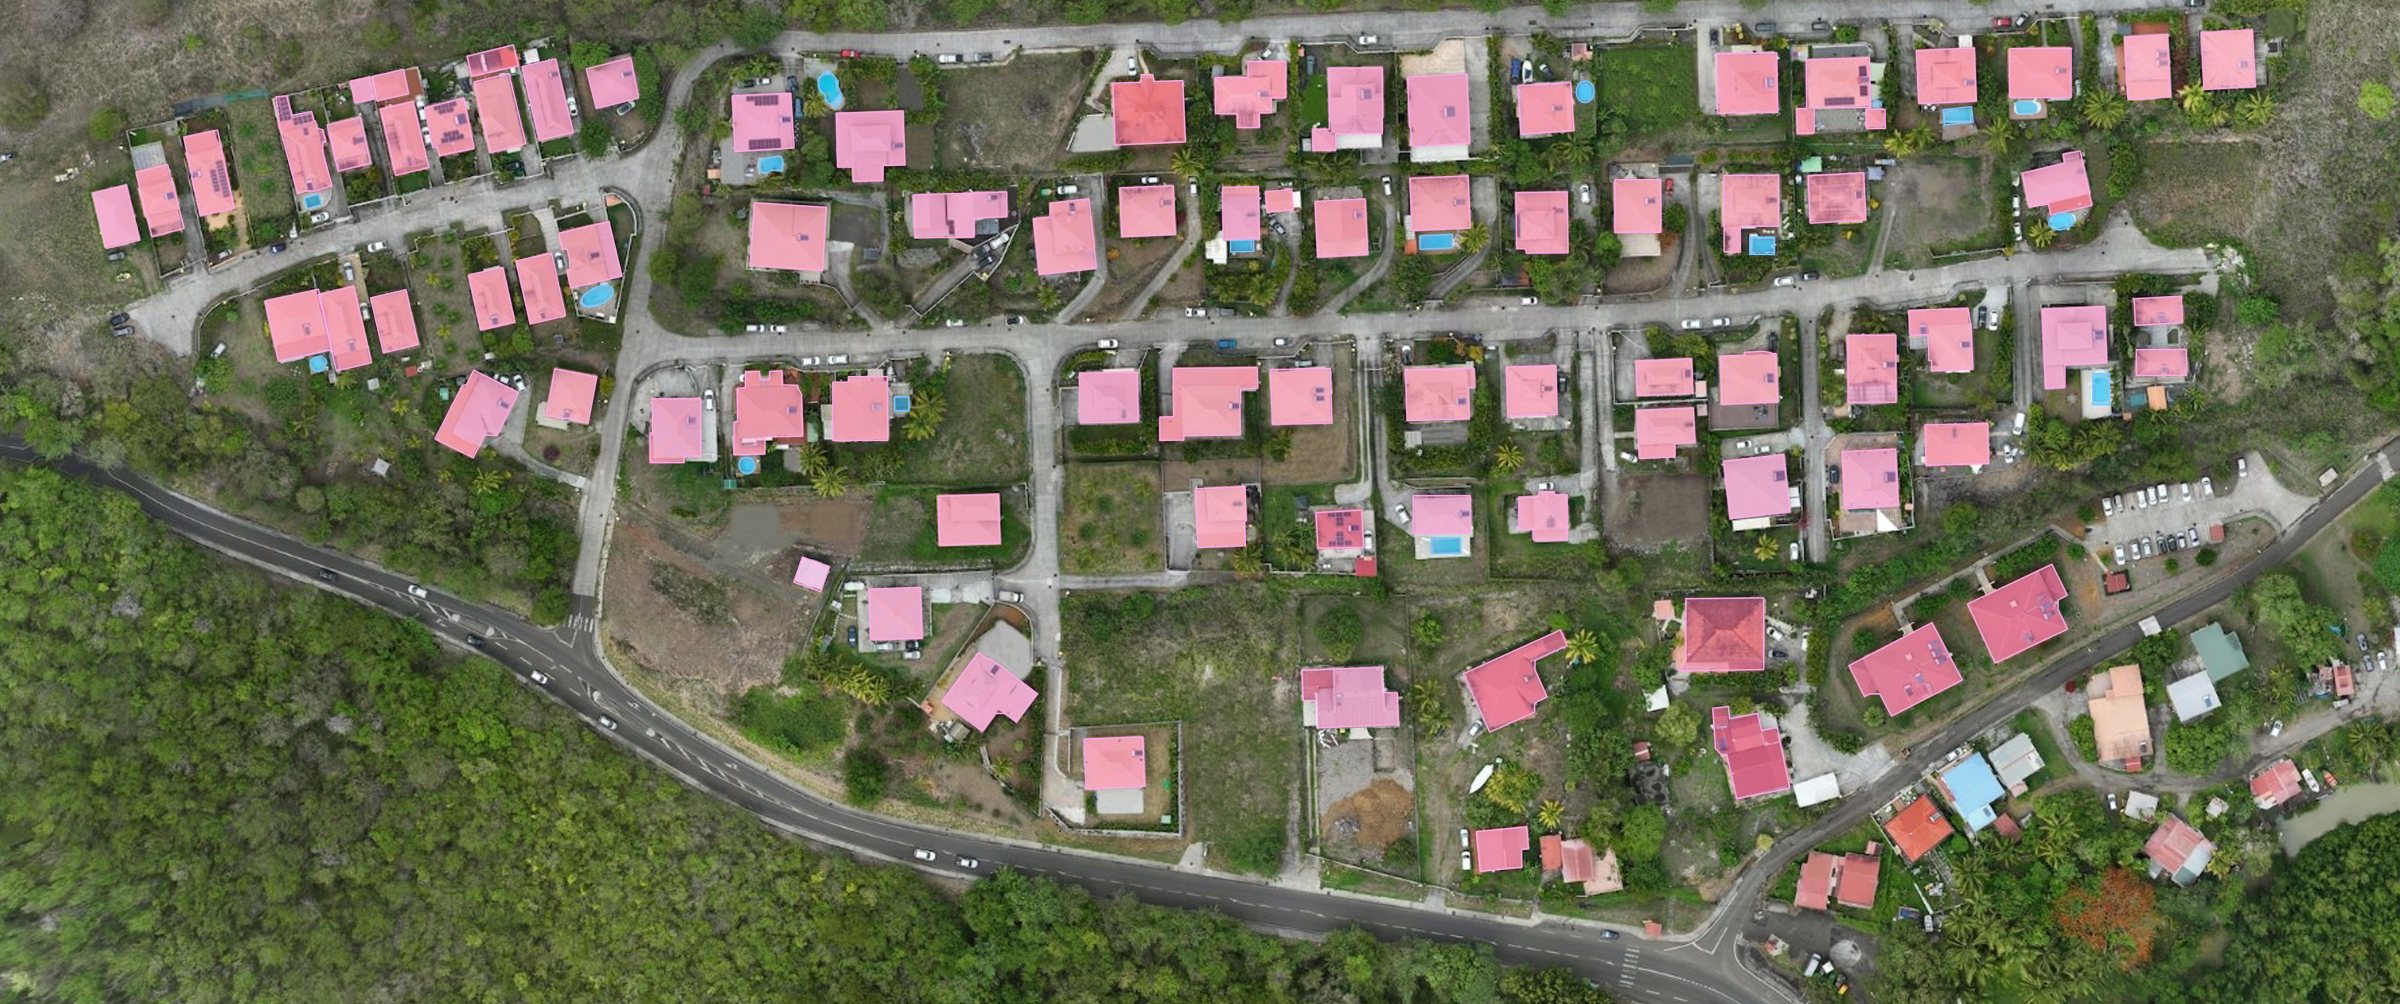
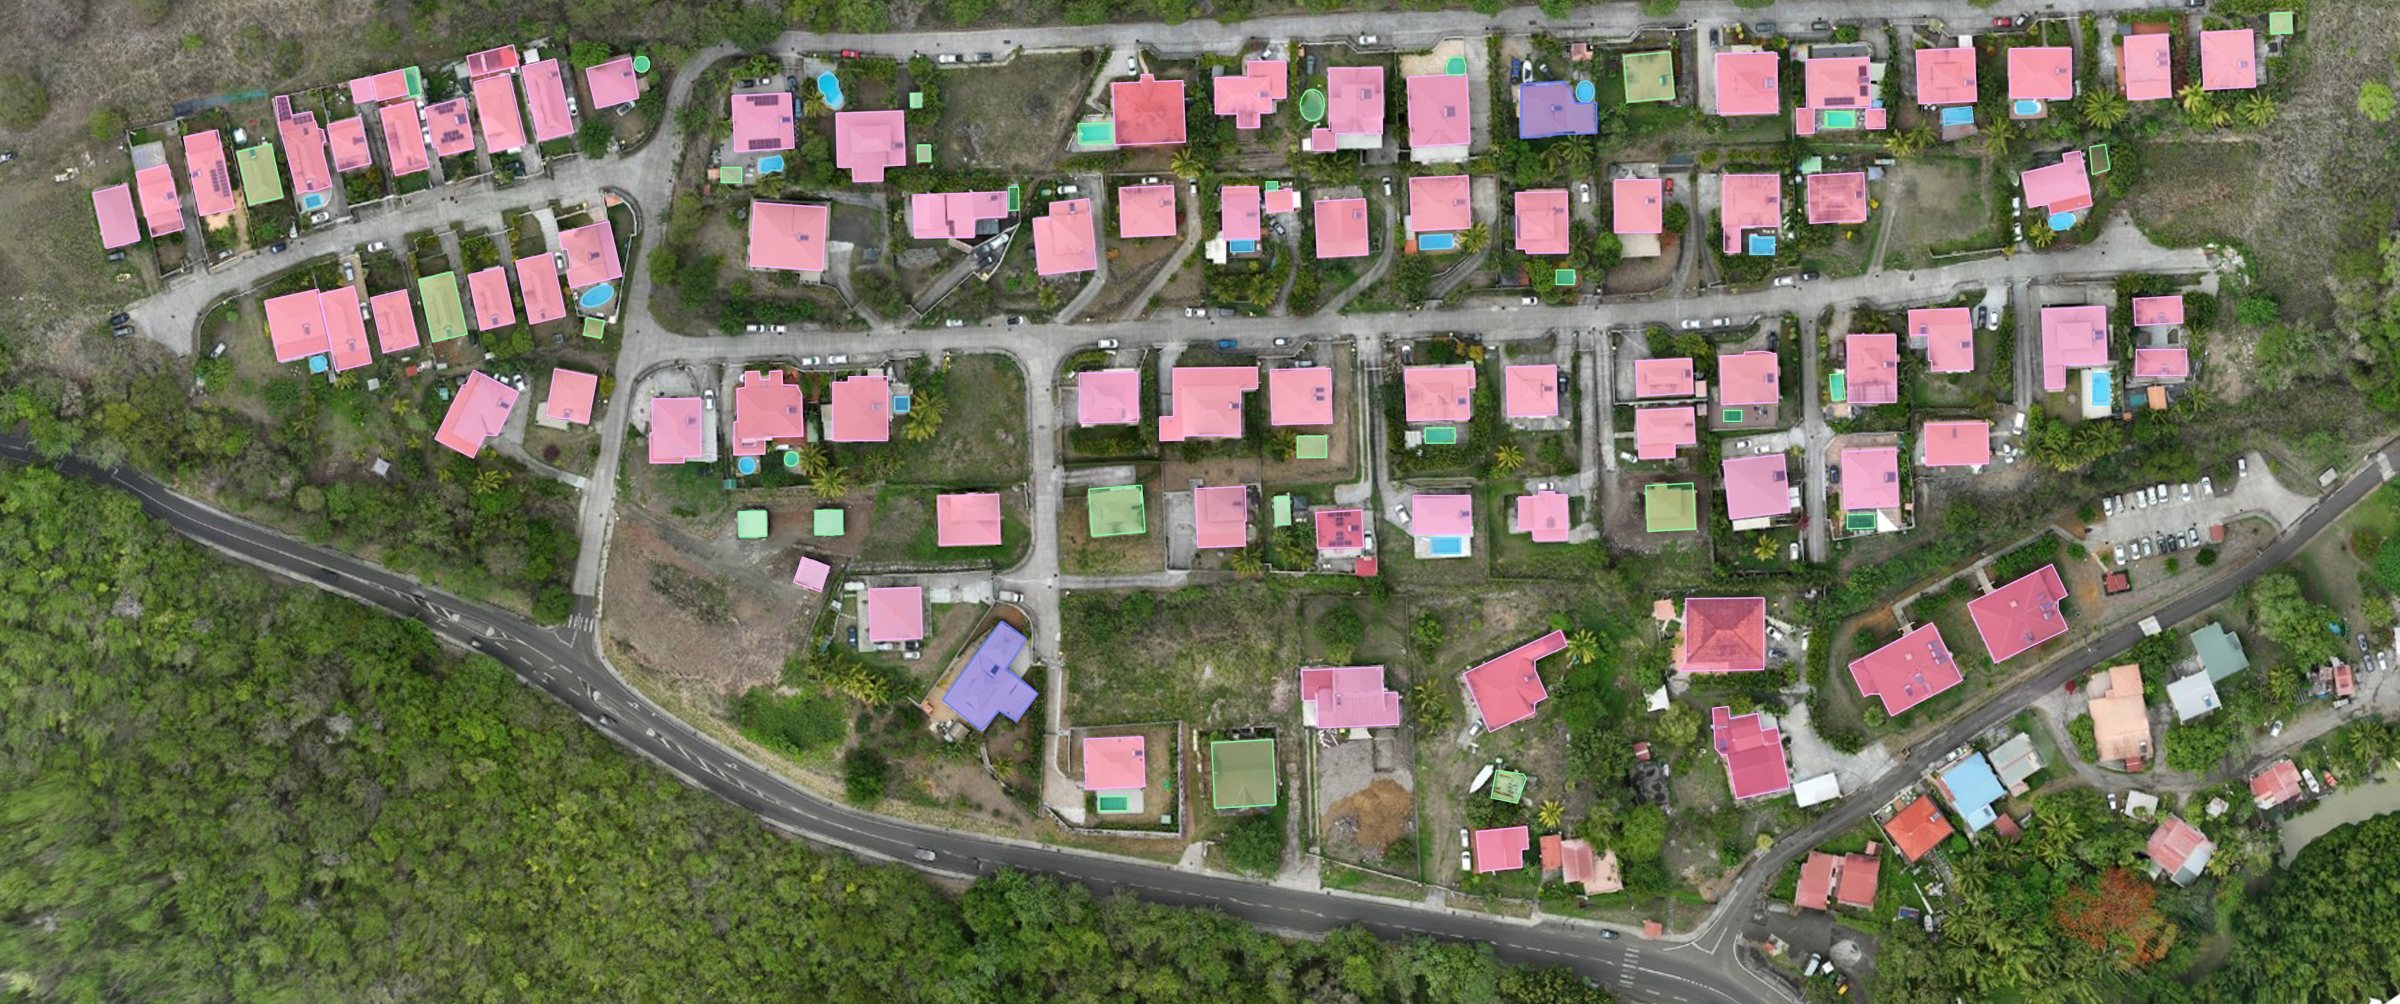
Drag the slider to compare the two campaigns. Illustrative example based on drone imagery and simulated data.
Initial analysis of the territory
- Identification and location of the objects present in the area of interest
- Cross-checking with available cadastral data
Comparing campaigns
- Comparing the data with the previous campaign
- Detecting changes: additions, modifications and removals
A complete processing chain
To turn imagery into usable territorial information.
1Acquisition
High-resolution aerial imagery by drone.
A drone flies over the area of interest and captures georeferenced aerial images, where each point of the image corresponds to a real position on the territory.
2Processing
Orthophotography and data preparation.
The images captured during the flight are stitched together to form an orthophotograph, an overview of the area, which is then prepared for analysis.
3Analysis
Automated analysis of objects and changes.
Automated analysis tools scan the orthophotograph to spot the features being sought: buildings, swimming pools, marine jetties, or any other specific request. During monitoring campaigns, they also flag what has changed: addition, modification or removal.
4Quality control
Checking and validation of results by our teams.
An automated result can contain errors. Our teams therefore check every detected item before delivering it, to qualify the results.
5Data cross-checking
Cross-checking with available cadastral and geographic data.
The features observed are matched against the available cadastral and geographic data, such as parcels. Any discrepancies between what exists on the ground and what is on record can then be identified, and each observation linked to the parcel concerned.
6Delivery of deliverables
Production of data and observation reports.
Results are delivered as an orthophotograph, a change map and a PDF observation report.
Deliverables your departments can use directly
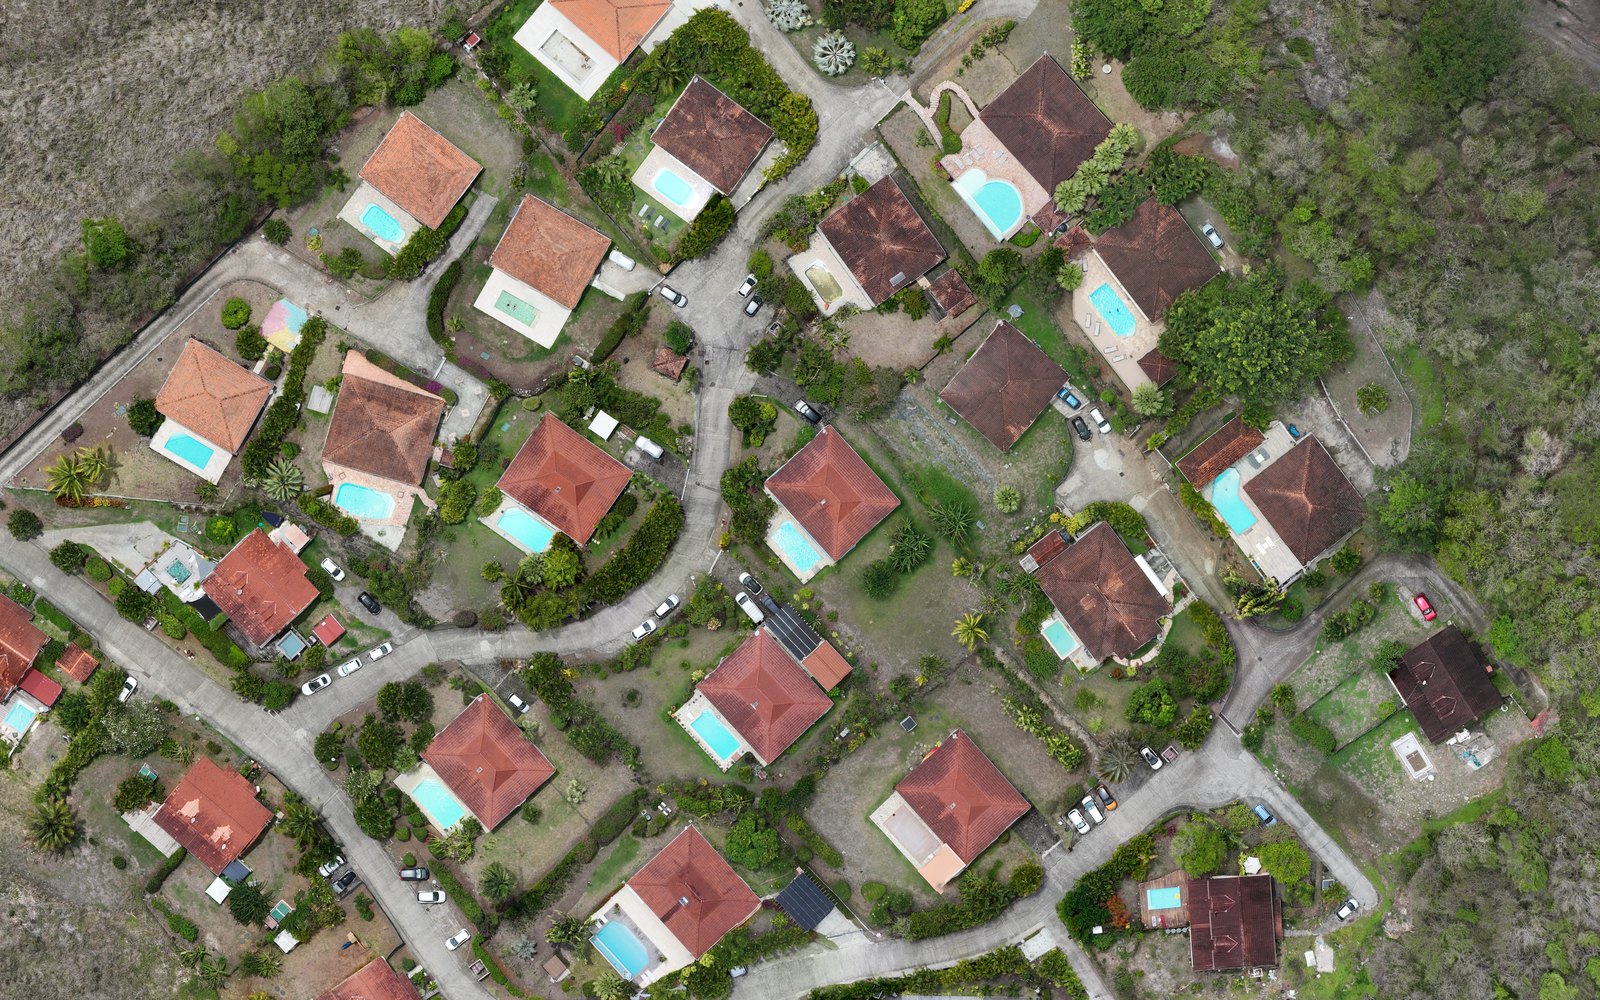
High-resolution orthophotograph
An up-to-date view of the territory.
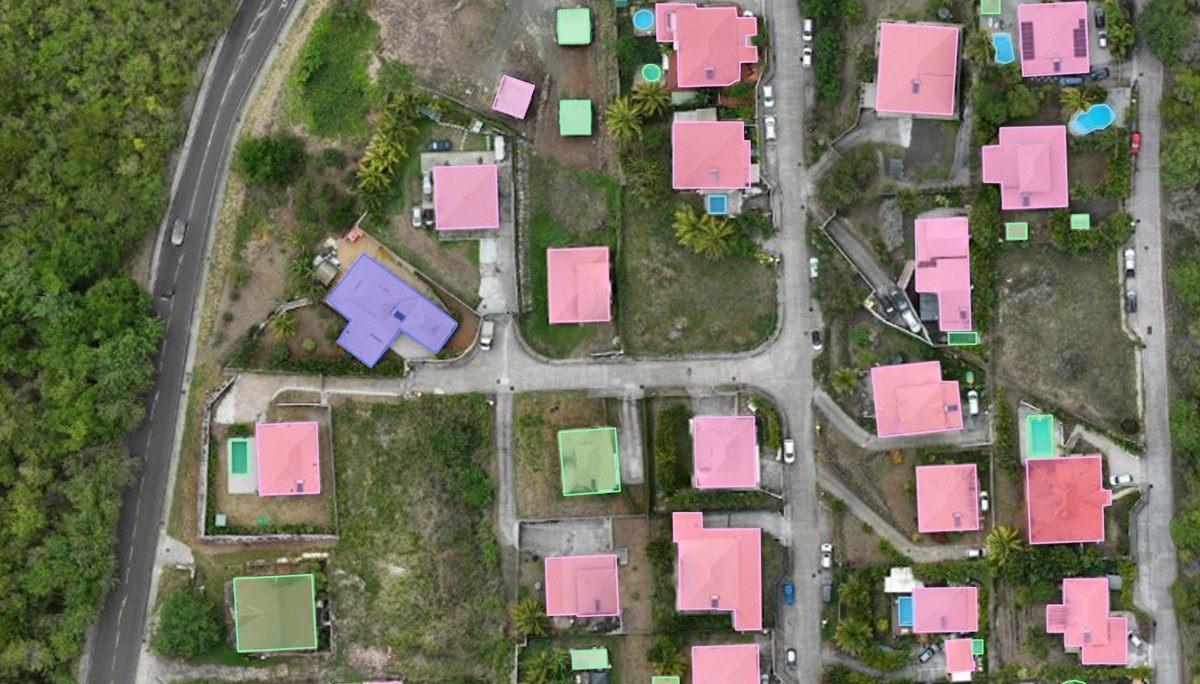
Change map
Location of the changes detected.
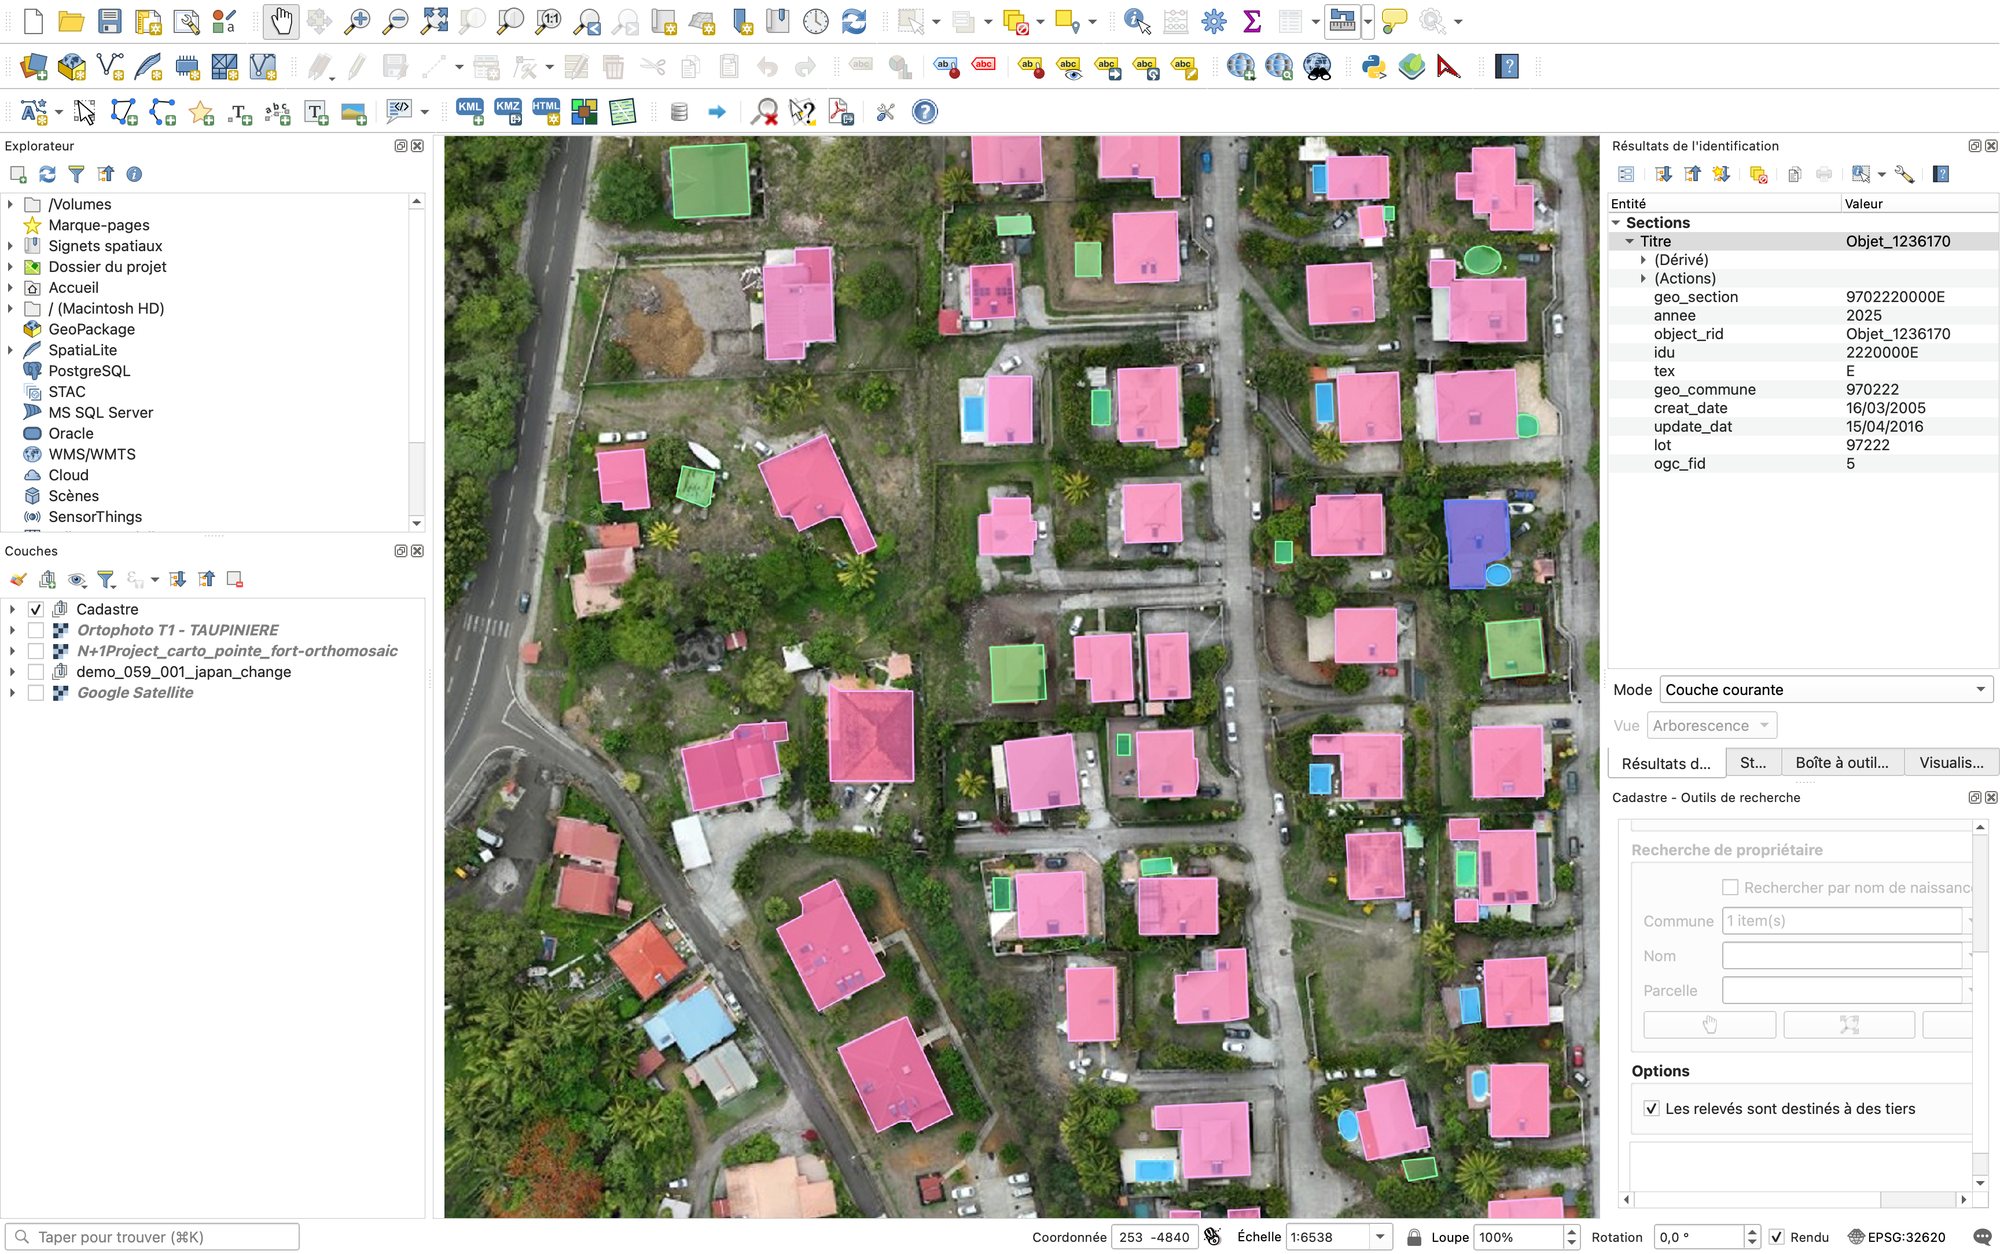
Structured GIS data
Information that can be integrated into your geographic tools.
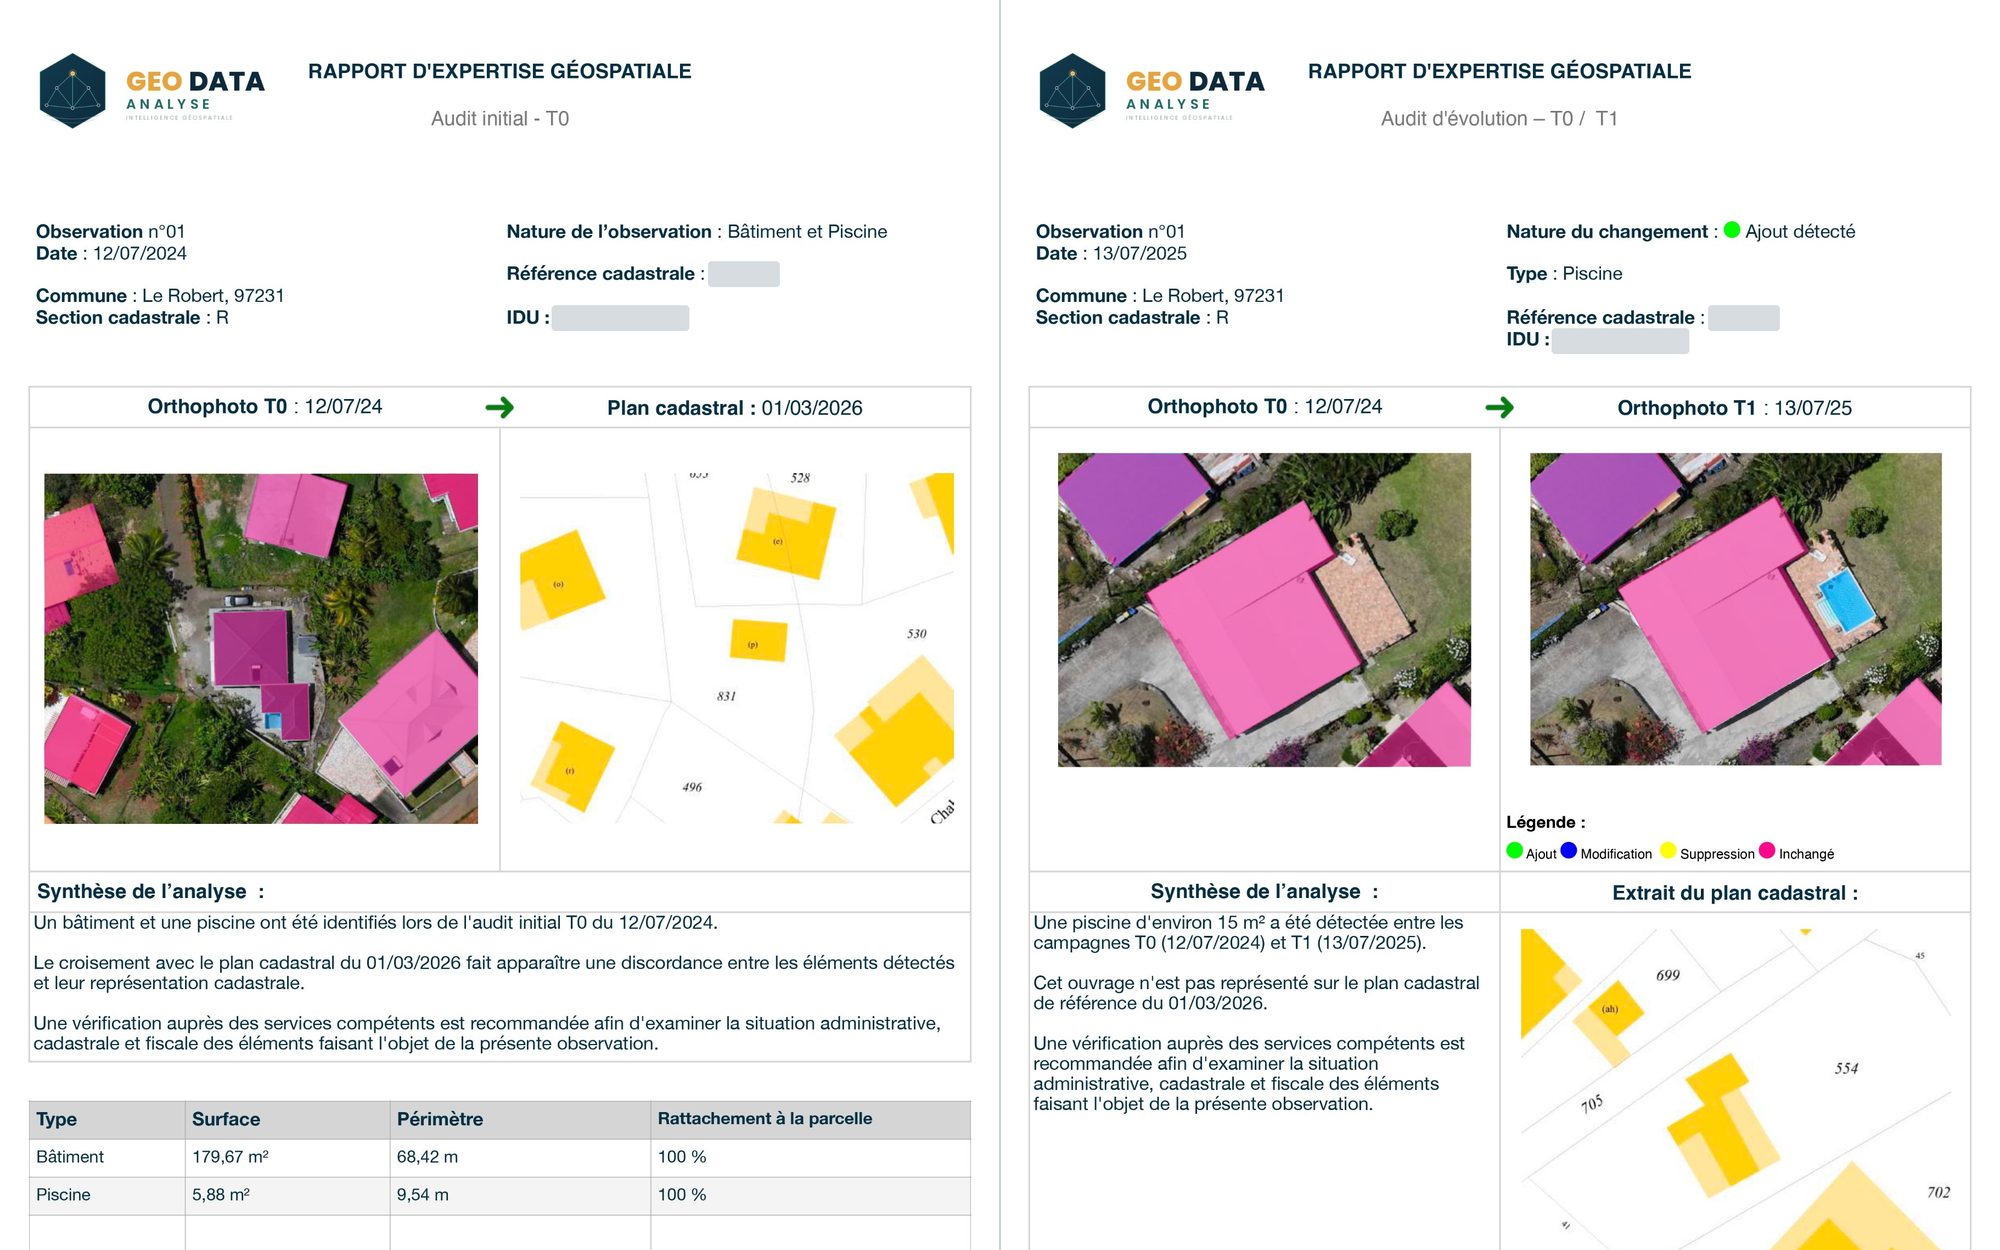
Observation report
Observation sheets linked to the parcels concerned.
A web platform to access your maps, data and reports, online, at any time.
Examples of observation reports
Whether it is the initial audit (T0) or change monitoring (T1, T2…), each sheet presents the observations made, their cadastral location and a summary designed to help the competent departments make use of them.
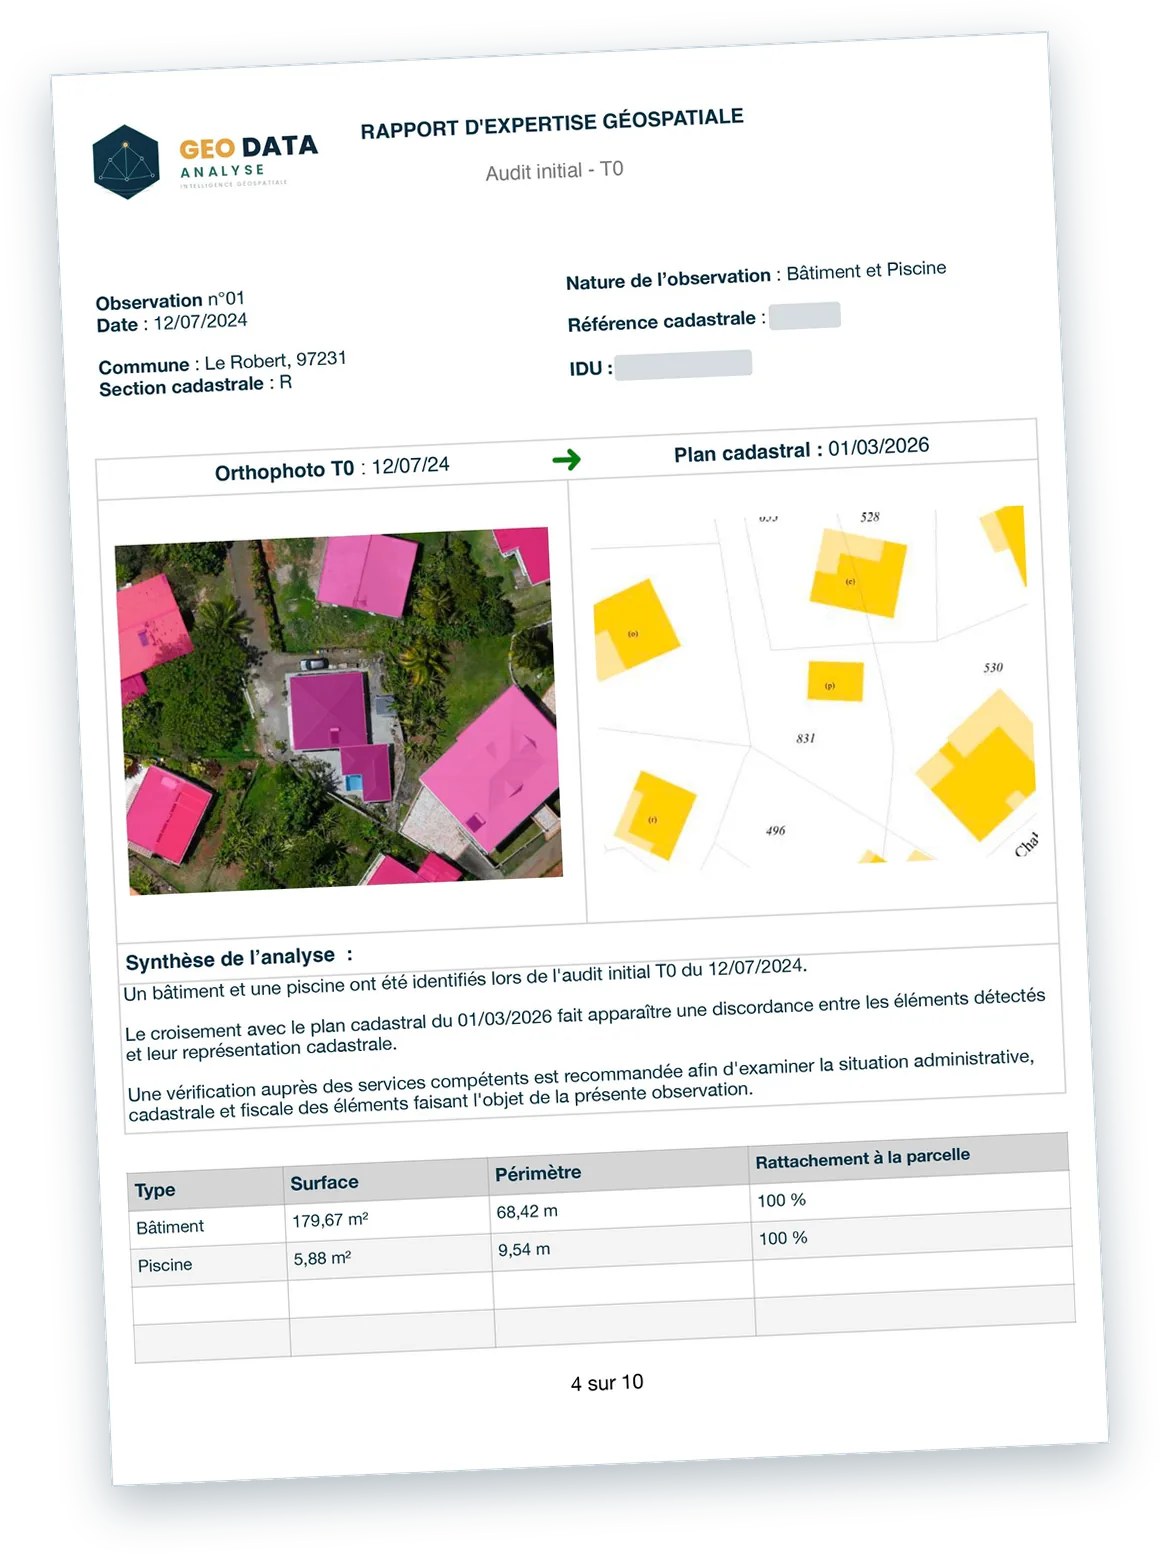
What we observe
On the T0 orthophotograph, a building (179.67 m²) and a swimming pool (5.88 m²) are identified on parcel R 831.
What this brings
Cross-checking with the cadastral map reveals a potential discrepancy and helps target the situations that need verification.
What happens next
The information collected forms a dated analytical baseline for detecting and documenting changes in subsequent campaigns.
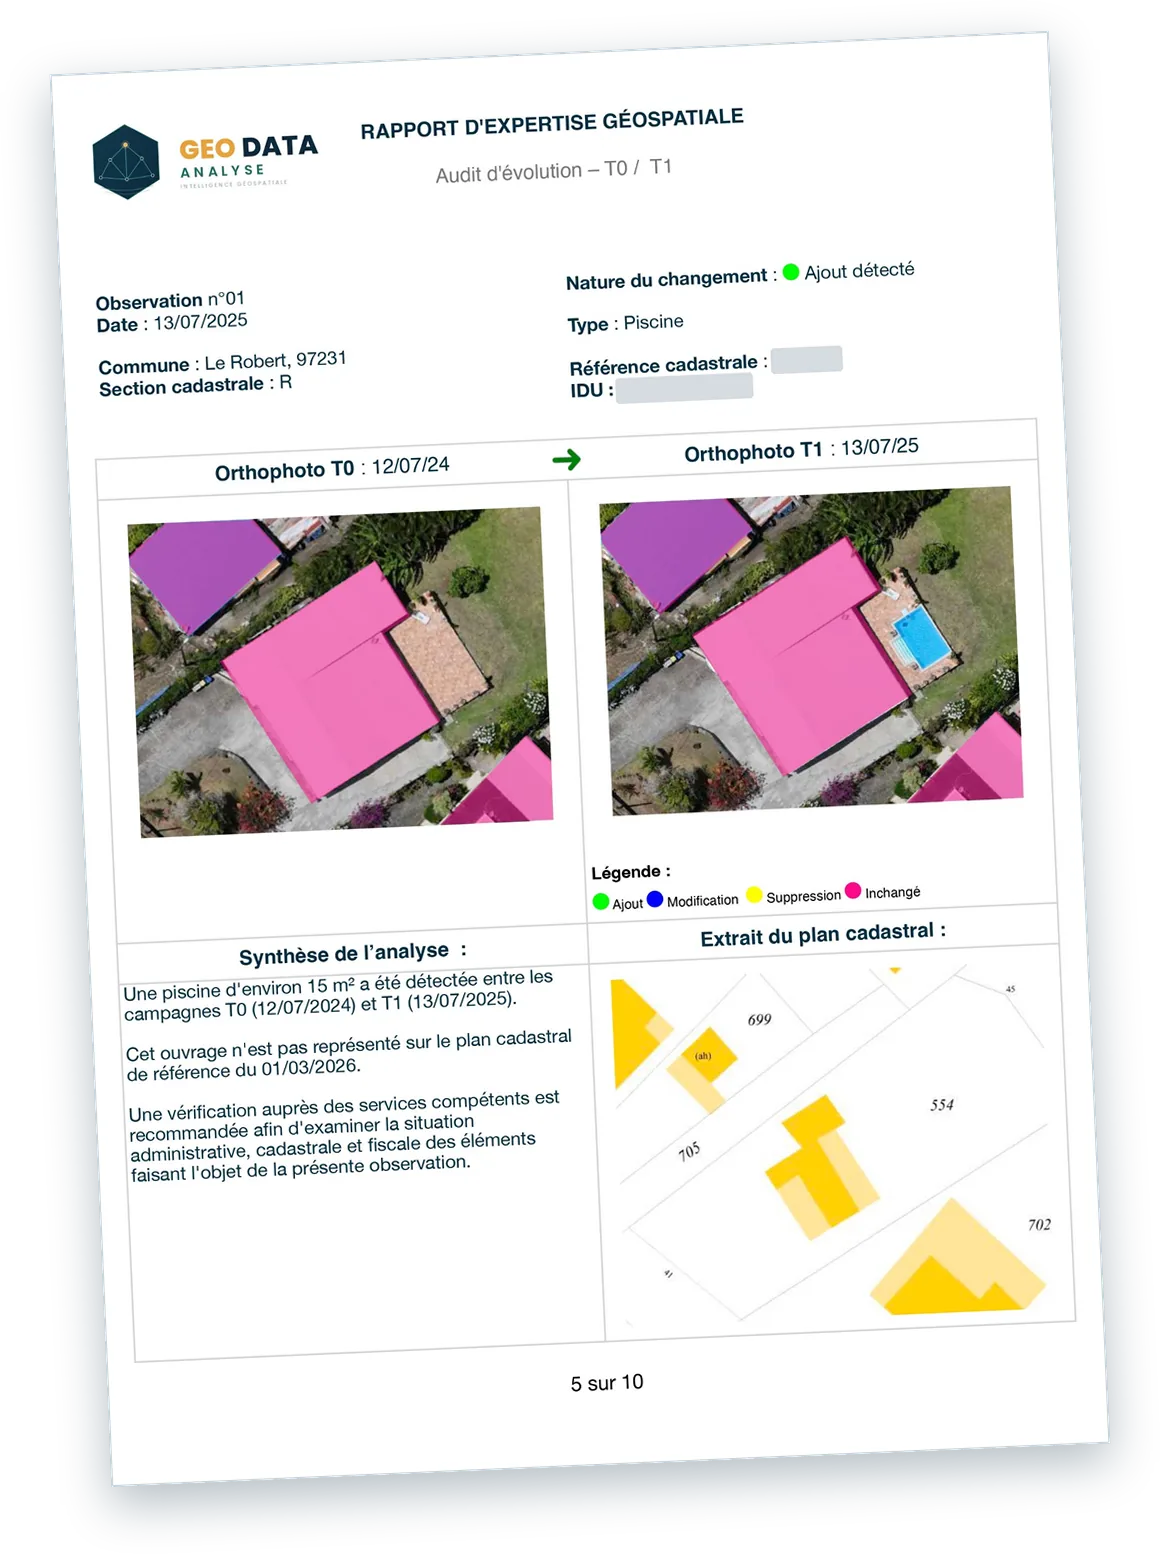
What we observe
A swimming pool of about 15 m² appeared between the T0 and T1 campaigns on the parcel concerned.
What this brings
This change is precisely located and documented. Cross-checking with the cadastral map reveals a potential discrepancy.
What happens next
The information collected allows the competent departments to target their checks and examine the administrative, cadastral and tax situation of the structure.
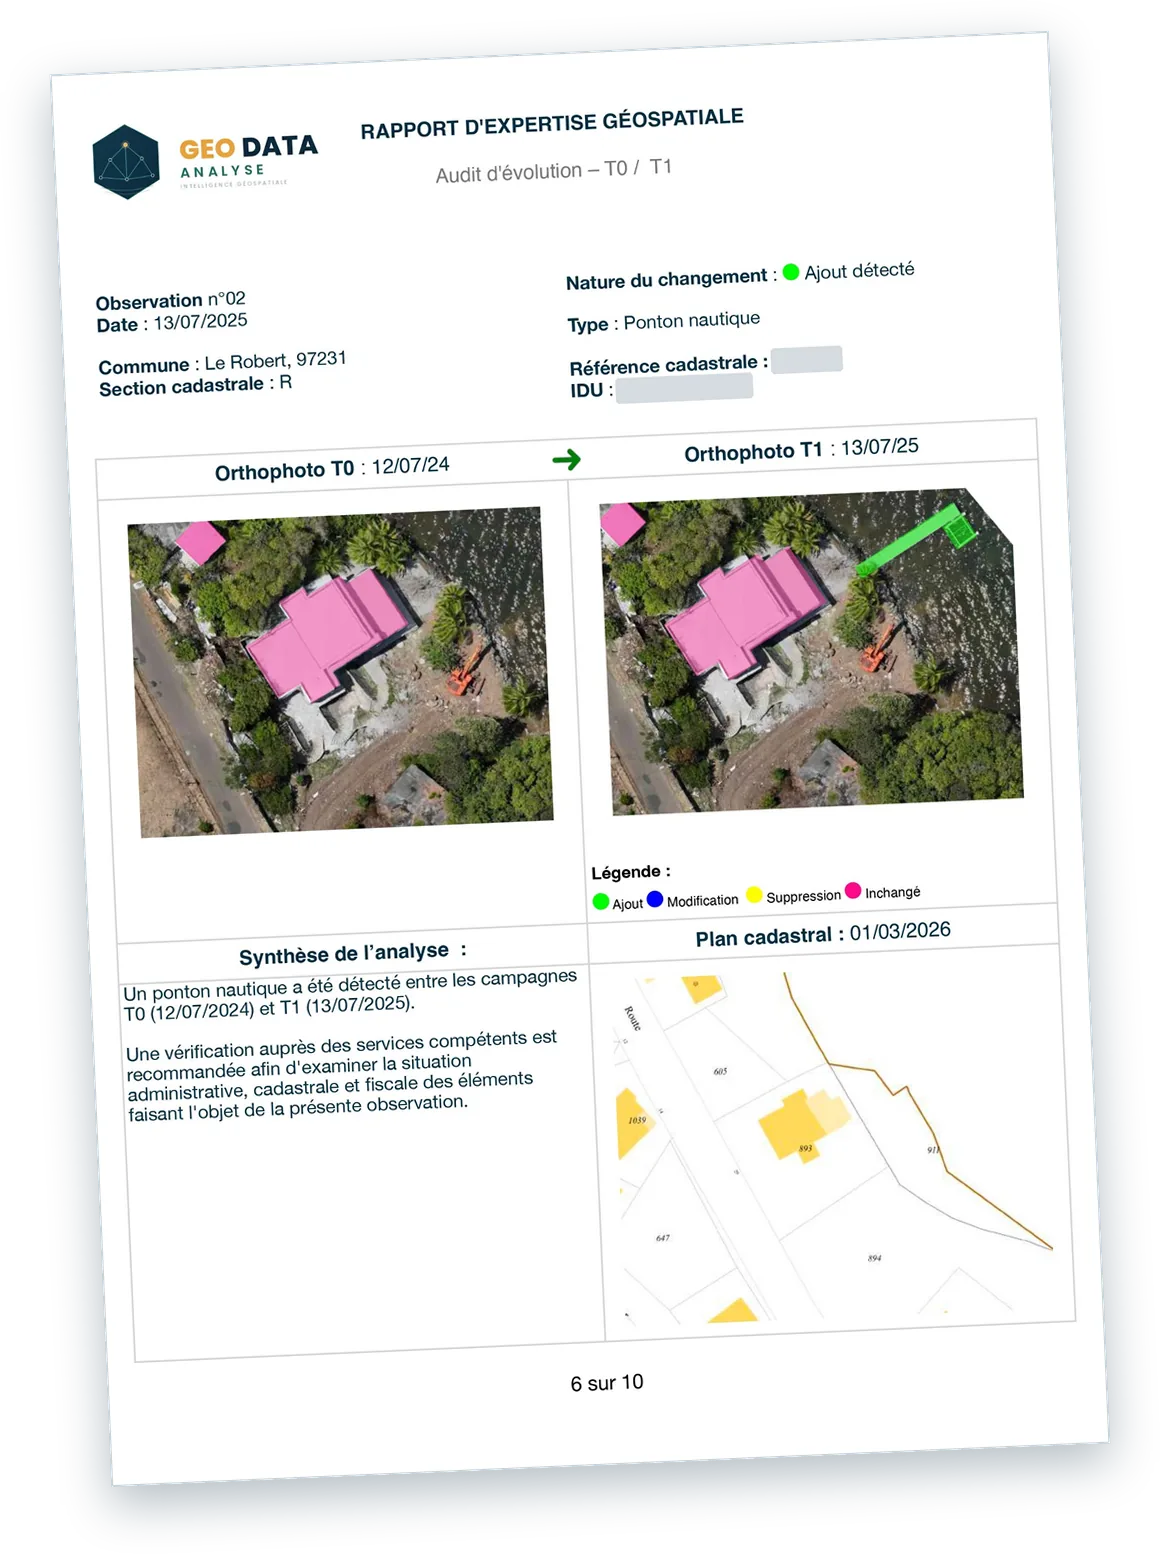
What we observe
A marine jetty is identified during the T1 campaign, whereas it was absent from the T0 orthophotograph.
What this brings
The structure is located and its appearance is documented by comparing the two campaigns, making it easier to monitor coastal developments.
What happens next
The competent departments can check whether the structure is covered by a temporary occupation authorisation (AOT) of the public maritime domain, and examine its situation with regard to the applicable rules.
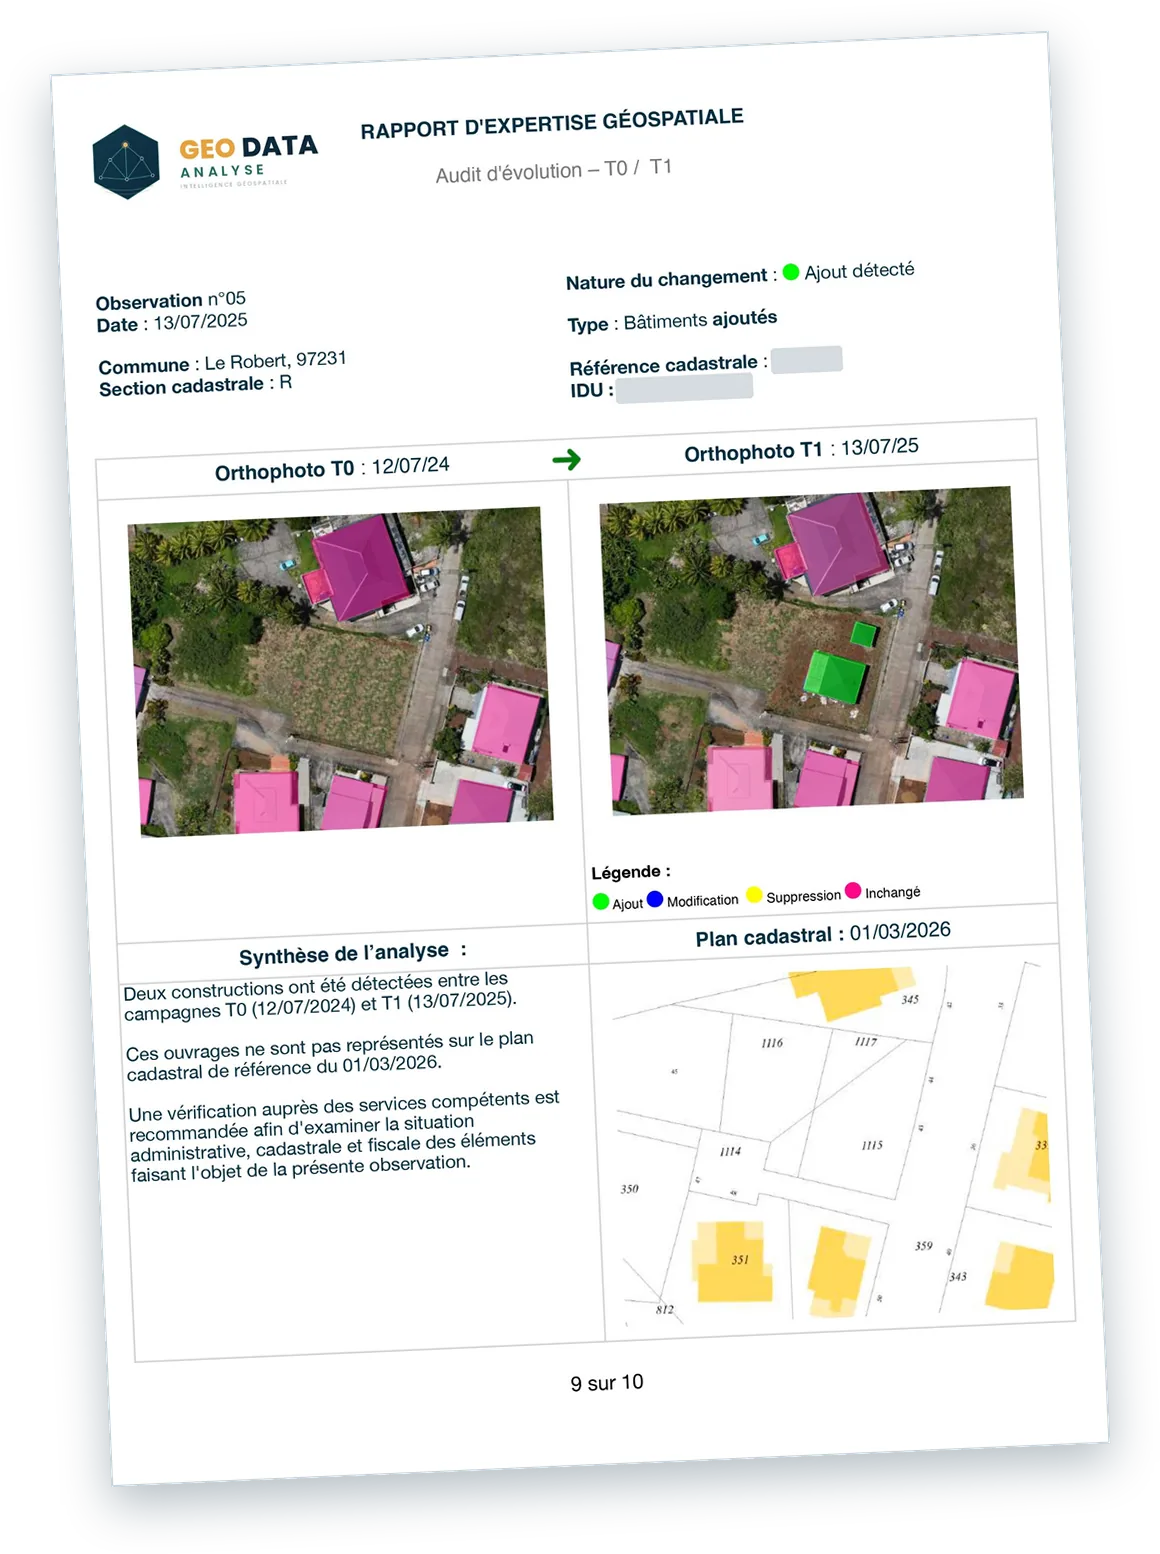
What we observe
Two constructions appeared between the T0 and T1 campaigns on the parcel concerned. They are absent from the T0 orthophoto and not shown on the reference cadastral plan.
What this brings
The structures are located and their appearance is documented. Their absence from the cadastral plan is a potential discrepancy between the ground and the cadastre.
What happens next
The competent departments can target their checks and examine the administrative, cadastral and tax situation of these constructions.
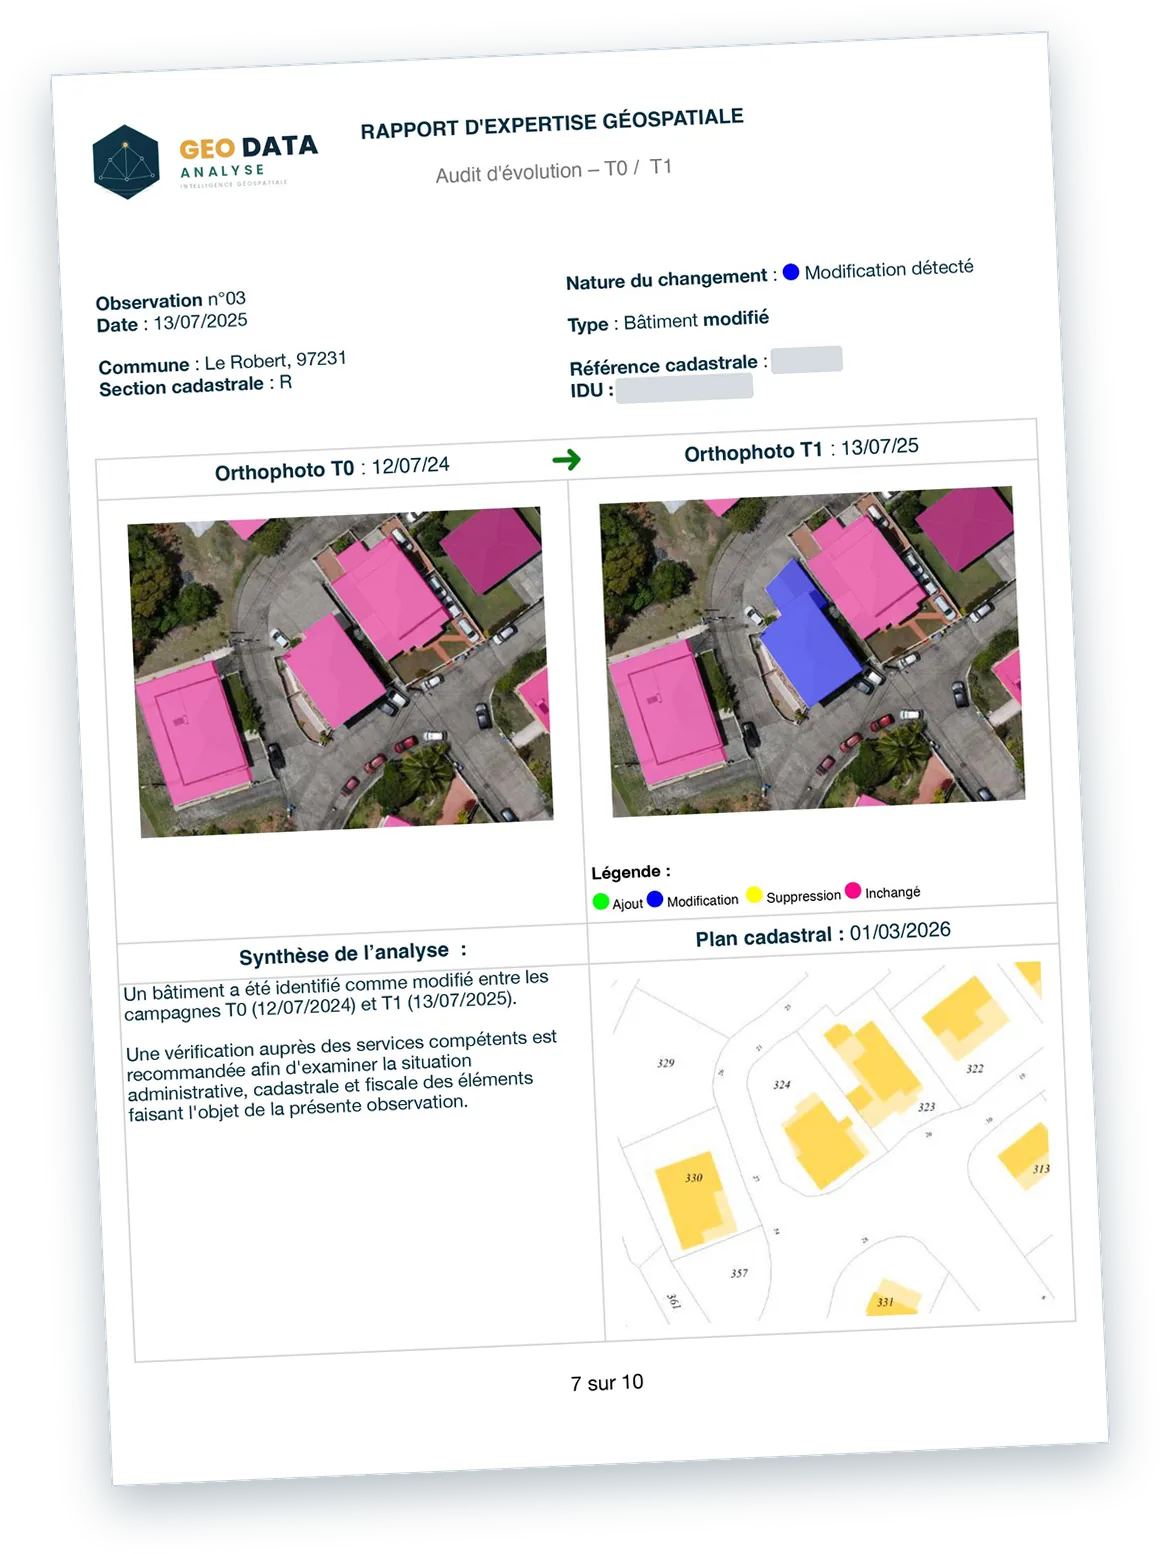
What we observe
An existing building whose footprint changed between the T0 and T1 campaigns: an extension appeared on the T1 orthophoto and is not shown on the reference cadastral plan.
What this brings
Comparing the two campaigns makes it possible to pinpoint the extension and to link it to the parcel concerned. Its absence from the cadastral plan is a potential discrepancy between the ground and the cadastre.
What happens next
This information makes it possible to check whether the extension was covered by the expected procedures and declarations, and to update knowledge of the built environment.
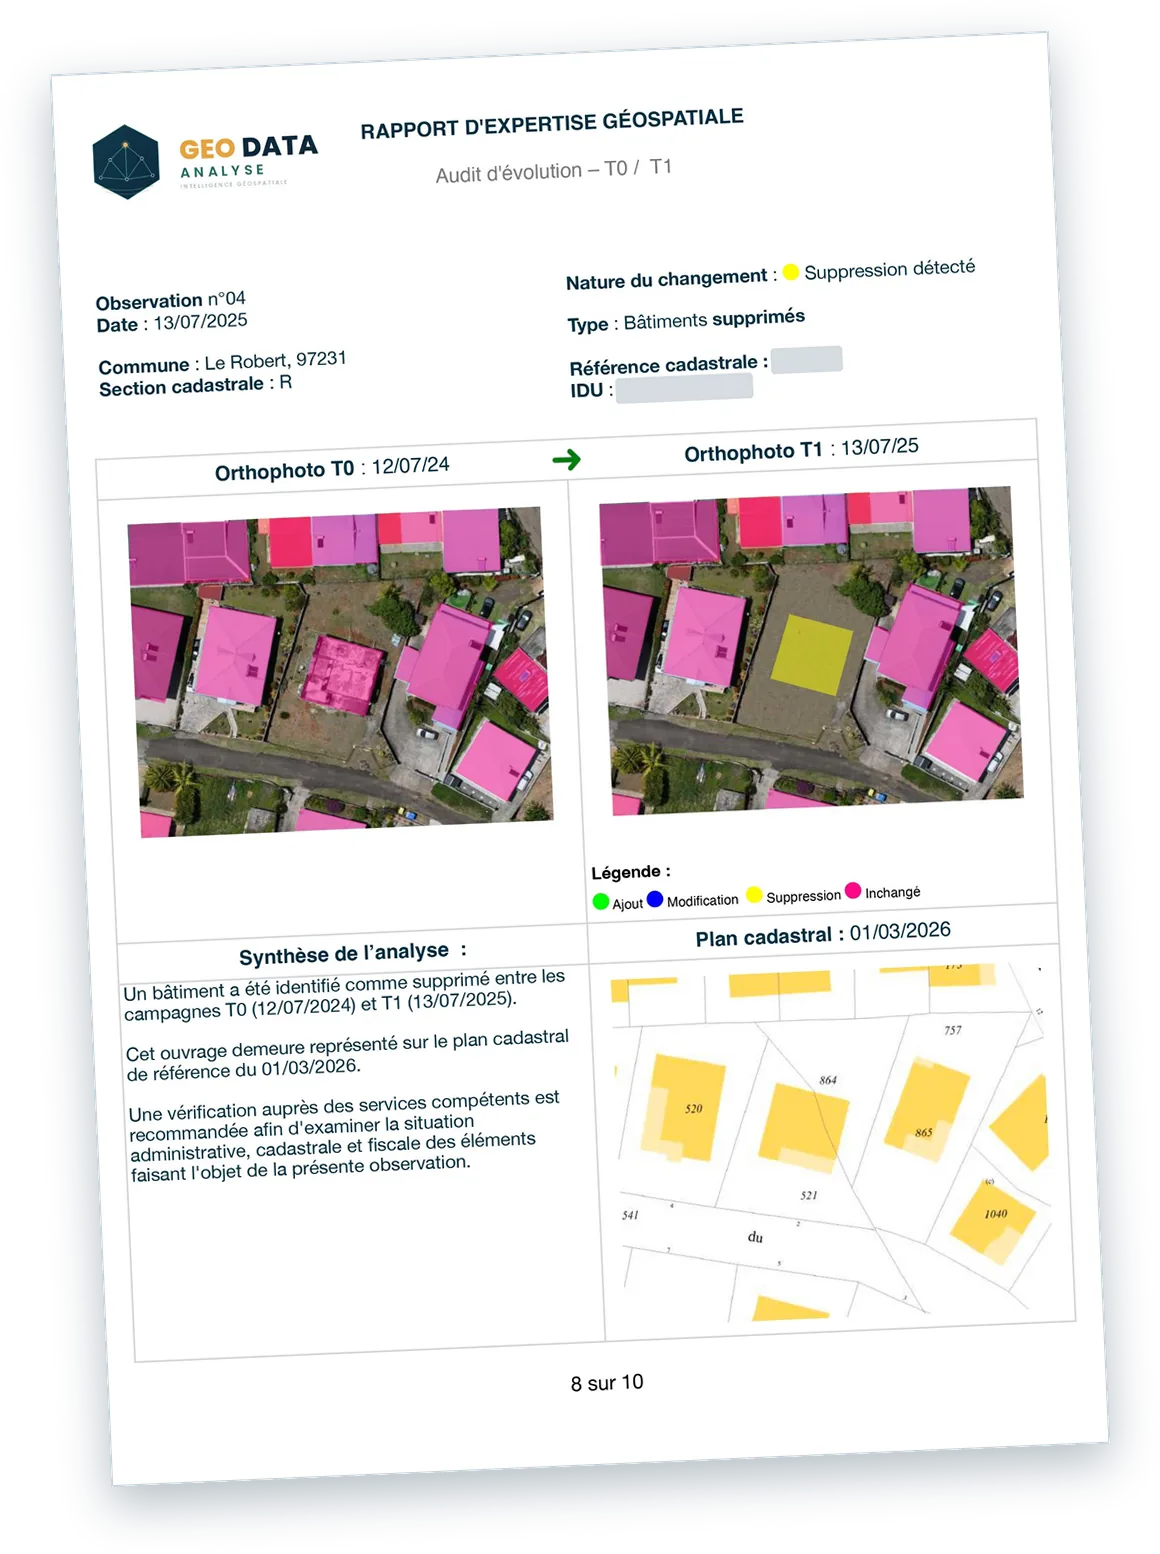
What we observe
A building present during the T0 campaign and absent from the T1 campaign, indicating a demolition. It is nevertheless still shown on the reference cadastral plan.
What this brings
The disappearance is documented and located on the parcel concerned. The structure's continued presence on the cadastral plan is a potential discrepancy between the ground and the cadastre.
What happens next
The competent departments can examine the situation of the parcel and update the cadastral and tax records where necessary.
Illustrative examples based on demonstration data, modified or adapted for testing purposes. The observations shown are not official findings.
Performance assessed against quality indicators*
Our analysis chain relies in particular on AI-based geospatial extraction technologies that meet high accuracy requirements.
Precision
At least 95% of detected objects are correctly identified.
Recall
At least 95% of the objects actually present are found.
Geometric accuracy (IoU)
An overlap of at least 95% with the reference geometry.
Valid geometries
Geometries that meet the defined validity criteria.
* Reference performance assessed against defined quality criteria and analysis conditions.
Additional human review to check and refine the results, strengthening their accuracy and reliability.
A powerful combination
Artificial intelligence, human expertise and GIS analysis.
A national-scale case study
Launched in 2021, the « Foncier innovant » project allows the DGFiP, France's tax authority, to use aerial imagery with artificial intelligence, in the service of tax fairness. Initially trialled on swimming pools in nine pilot départements in 2022, it delivered concrete results.
new swimming pools taxed¹
Detected by AI during the pilot phase.
in additional revenue¹
€4.1M of recurring annual property tax and €5.7M of back-taxes.
of owners confirmed¹
That their swimming pool was taxable.
in revenue expected in 2023¹
National projection issued by the DGFiP in 2022.
A broader approach with GEO DATA ANALYSE
Our expertise extends observation to buildings, swimming pools and other developments, with validation of the results before delivery.
¹ DGFiP, L'intelligence artificielle au service de la lutte contre la fraude : bilan de l'expérimentation « Foncier innovant » (Artificial intelligence in the fight against fraud: review of the « Foncier innovant » trial), August 2022.

Get to know us
Florian PRIAM has built his career between buildings, data and professional drones. Find out what led him to create GEO DATA ANALYSE.
Discover his backgroundLet's discuss your authority's needs
Every territory has its own challenges. Let's explore together the possibilities of a territorial observation programme tailored to your priorities.
- contact@geodata-analyse.fr
- +596 696 32 57 29
- Martinique